Help
Overview
Getting Started
Using Easy-Commission Application
Rep
Master Data
Calculation Rules
Transactions
Calculation Process
Dashboard
Commission Statements
Period Close
Year End
Configuring Easy-Commission Application
User Setup
Appendix
Help
Overview
Getting Started
Using Easy-Commission Application
Rep
Master Data
Calculation Rules
Transactions
Calculation Process
Dashboard
Commission Statements
Period Close
Year End
Configuring Easy-Commission Application
User Setup
Appendix
Dashboard is a group of different charts such as Pie, Doughnut, Bar and List that graphically display your reps' data. Dashboard is the representation of the attainment of all Rep's against credits and transactions in chart for the current year.
Administrator and Sales Manager Dashboard
Administrator and Sales Manager can view the graphical representation of
1. Top 10 Product Sales for the Year: Top 10 products for which the rep earned the most commissions for the year, in Pie chart format
2. Top 10 Customer Sales for the Year: Top 10 customers for which the rep earned the most commissions for the year, in Doughnut format
3. Top 10 Rep Sales Credits: Top 10 transactions for which the rep had the most credit, in List format. This would normally be equal to the sales amount
4. Top 10 Rep Commissions Earned: Top 10 transactions for which the rep earned the most commissions, in List format
To view the Dashboard, do the following:
1. Click Tools ? Dashboard submenu item. The 'Dashboard' page opens.
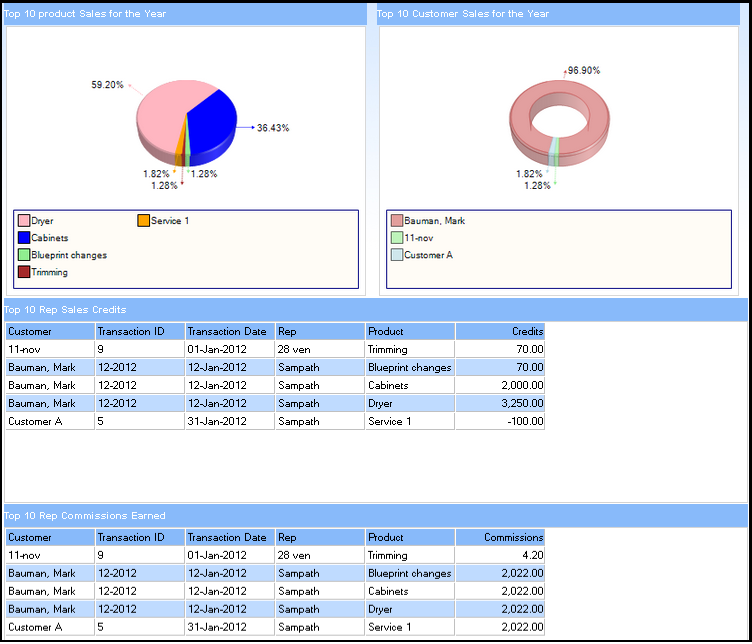
2. Here, you can view the graphical representation of "Top 10 Product Sales for the Year", "Top 10 Customer Sales for the Year", "Top 10 Rep Sales Credits", and "Top 10 Rep Commissions Earned".
Sales Rep Dashboard
Sales Rep can view the graphical representation of
1. Next 10 Opportunities to follow up: Next 10 opportunities which the Rep should follow up, in List format
2. Hot 10 Opportunities: Hot 10 opportunities, which brings more revenue to the company, in List format
3. Top 5 Products with Cumulative Revenue for the year 2012: Top 5 products based on their cumulative revenue to the company for current year, in Pie chart format
4. Top 10 Customer Commissions for the Year 2012: Top 10 customers for which the rep earned the most commissions for the current year, in Doughnut format
5. Year-to-date Commissions: Periodic commissions for the year in Bar chart
6. Top 10 Product Commissions for the Year 2012: Top 10 products for which the rep earned the most commissions, in Pie chart format
7. Top 5 Customers with Cumulative Revenue for the year 2012: Top 5 customers based on their cumulative revenue to the company for current year, in Doughnut format
Please follow the steps given below to view the rep's Dashboard:
1. Click Tools ? Dashboard submenu item. The 'Dashboard' page opens.
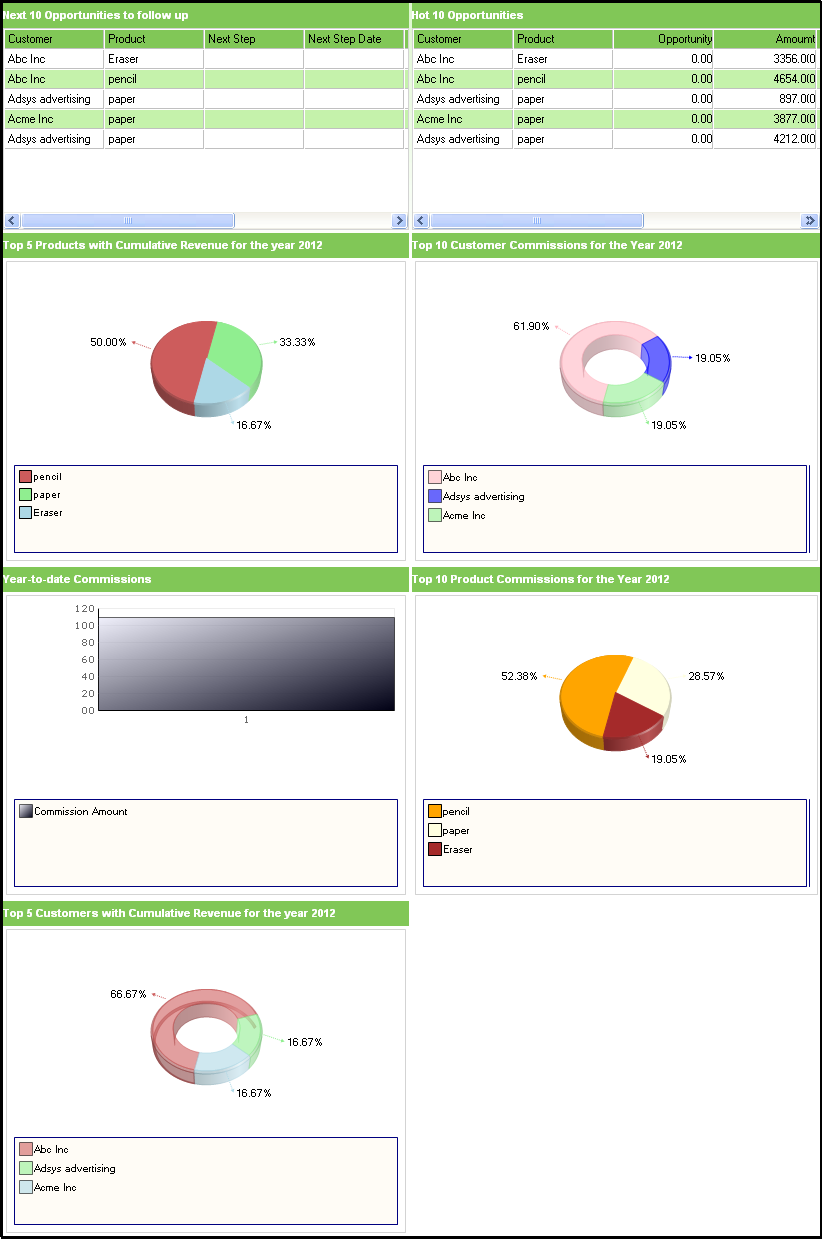
2. Here, you can view the graphical representation of "Next 10 Opportunities to follow up, Hot 10 Opportunities, Top 5 Products with Cumulative Revenue for the year 2012, Top 10 Customer Commissions for the Year 2012, Year-to-date Commissions, Top 10 Product Commissions for the Year 2012, and Top 5 Customers with Cumulative Revenue for the year 2012.
